4 Goal-Setting Charts Trainers Use (and You Can Too)
When someone comes to me and says, “I want to get healthier,” my first question is, “What does that look like for you?” Most people have a feeling in mind, like more energy or clothes fitting better, but no way to measure it. That’s where a few simple charts help.
I’ve been coaching since 2001, and I still use versions of these four charts. They’re not about chasing perfect numbers. They’re a map that shows you where you are, so you can pick a next step that’s realistic.
One thing I’ve never loved is BMI as a goal-setting tool. It doesn’t know the difference between muscle and fat, so it won’t be on this list.
Chart 1: Body fat percentage ranges
In my experience, body fat percentage is the number clients most want to see change, more than the scale. The most important part is measuring it the same way, at the same time of day, every time. A decent home scale with body fat tracking is fine for watching trends. Don’t stress about the exact number; the direction over a few months matters more.
Here are the general ranges used by the American Council on Exercise:
| Category | Women (% fat) | Men (% fat) |
|---|---|---|
| Essential fat | 10-13% | 2-5% |
| Athletes | 14-20% | 6-13% |
| Fitness | 21-24% | 14-17% |
| Average | 25-31% | 18-24% |
| Above average | 32% and up | 25% and up |
These ranges are a guide, not a judgment. Home devices can be off by several points, so use your own trend line rather than comparing yourself to someone else.
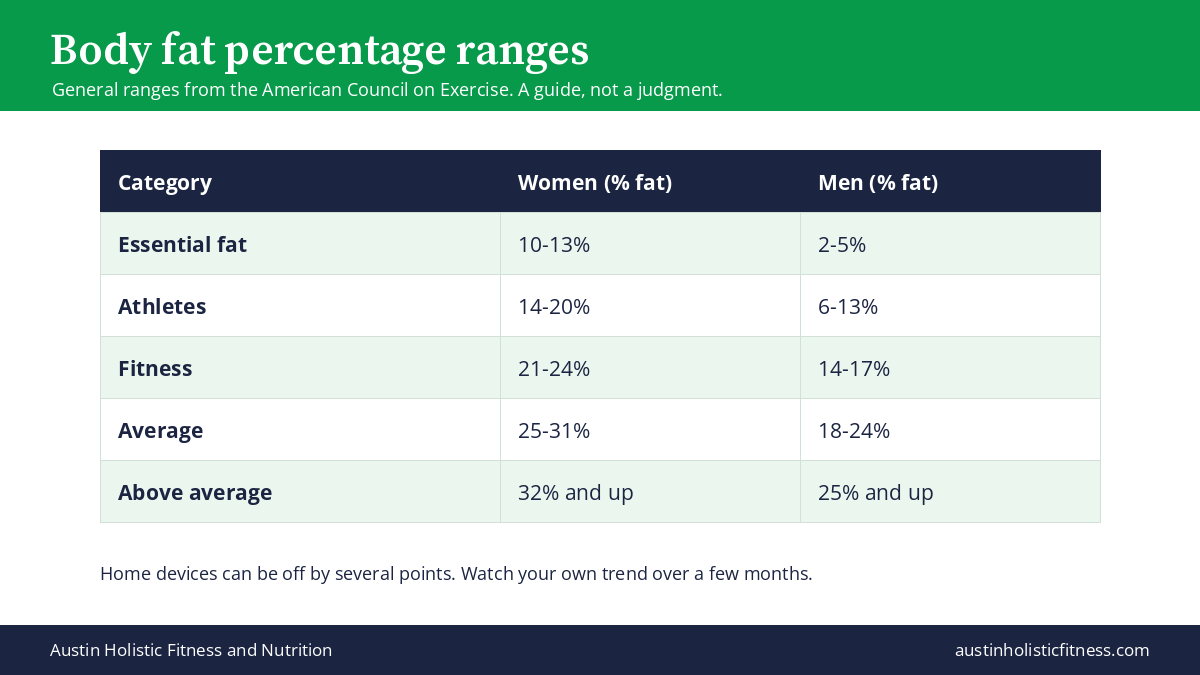
Chart 2: Heart rate zones
Heart rate zones help you know how hard you’re working. A common rough estimate of maximum heart rate is 220 minus your age. Most moderate cardio happens at about 50 to 70 percent of that number, and harder intervals at about 70 to 85 percent.
| Age | Moderate zone (50-70%) | Harder zone (70-85%) |
|---|---|---|
| 30 | 95-133 bpm | 133-162 bpm |
| 40 | 90-126 bpm | 126-153 bpm |
| 50 | 85-119 bpm | 119-145 bpm |
| 60 | 80-112 bpm | 112-136 bpm |
This formula is a general estimate, and real people vary a lot. If you take heart medication or have any heart concerns, check with your doctor before using these zones. A good program changes the zones from week to week instead of staying at one intensity all the time.
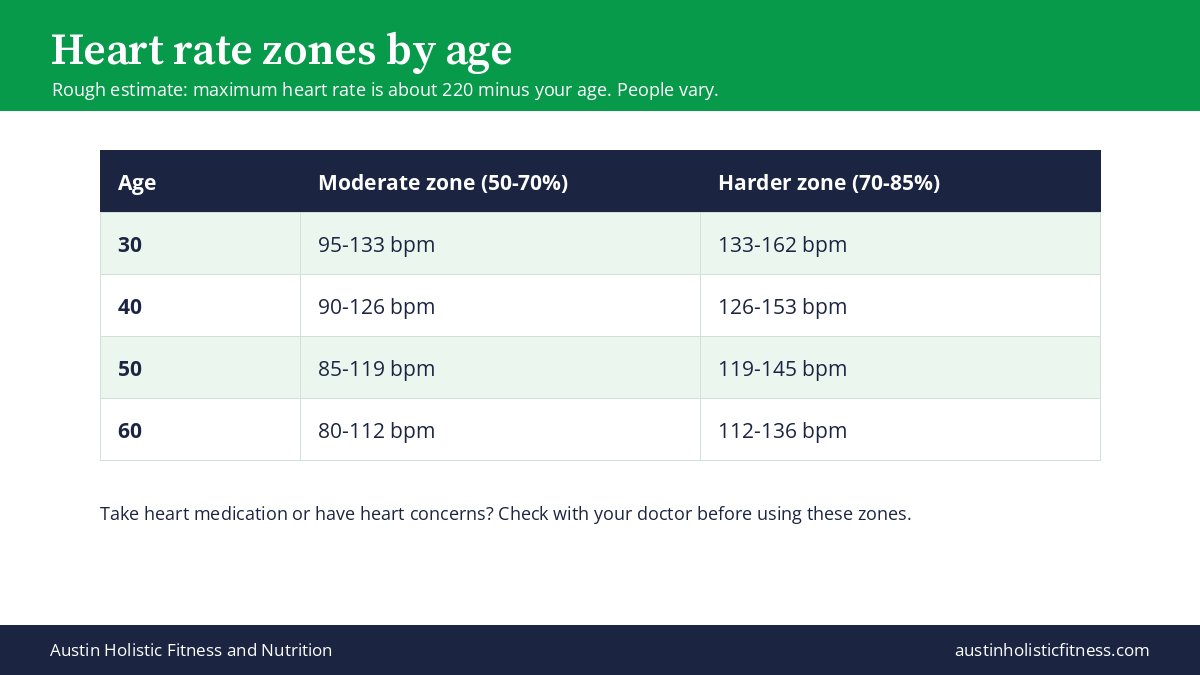
Chart 3: Energy in, energy out
The old version of this post had a chart of calories burned. My thinking has changed since then. We don’t count calories in our program, because in our experience it makes people anxious and doesn’t last.
Instead, I like a simple two-column chart. On the left, write what gives you energy: meals with vegetables and protein, a good night’s sleep, a walk outside, time with friends. On the right, write what drains it: skipped meals, late nights, long days at a desk, stress.
Look at it once a week. Your goal is to add one thing to the left column, not to be perfect. Think of it like a bank account. Every good habit is a small deposit, and over time those deposits add up.
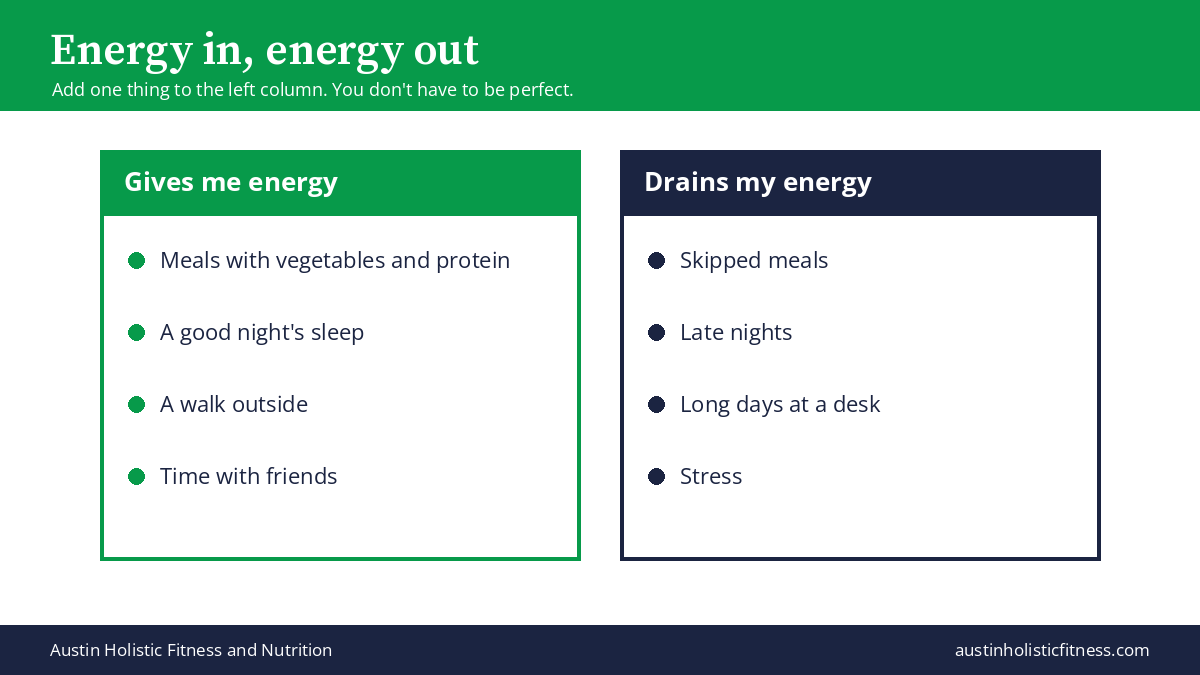
Chart 4: The habit tracker
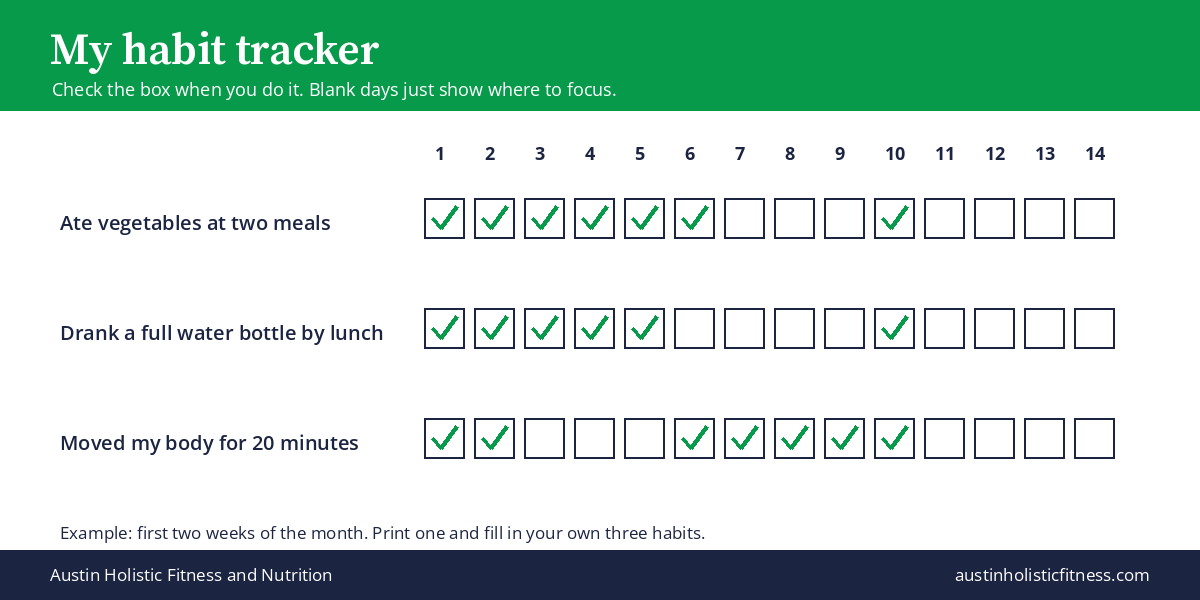
This is the chart I care about most. Results come from habits, and habits are easy to track. Make a simple grid with the days of the month across the top and three habits down the side, for example:
- Ate vegetables at two meals
- Drank a full water bottle by lunch
- Moved my body for 20 minutes
Check the box when you do it. That’s all. After a few weeks you’ll see patterns: which days are hard, which habits stick, and where you need support. No shame on the blank days. They just tell you where to focus.
How to put the four charts together
Here’s how I’d use them if I were starting today:
- Measure your body fat once and write it down. Then leave it alone for a month.
- Learn your rough heart rate zones so you know what “moderate” feels like.
- Fill out the energy chart and pick one thing to add.
- Track three habits every day for 30 days.
The numbers from charts 1 and 2 tell you where you are. Charts 3 and 4 are how you actually get somewhere.
Want help setting goals?
Goal setting is a big part of how we coach in the 8-Week Program, with check-ins along the way. If you’d like a gentler first step, our $27 7-Day Reset gives you a week of simple habits to try. You might also like why working out harder can stall weight loss.
Which of these charts would help you most right now? Tell me below.